
Introduction
Introduction#
Welcome to the Durham University Climate Data Science Project Book. This book aims to build a syllabus that uses the case study of climate science to teach data-intensive science skills.
The book comprises multiple Jupyter notebooks following multiple case studies focused on the effects of climate change. Each book page has a corresponding notebook with executable code that can be copied and adapted to the exercises. The Notebooks themselves can be downloaded from the button in the top right corner.
The code we felt was necessary for understanding is displayed and annotated with a multiline comment. In addition, some code can only be found when looking at the raw notebook files, such as imports and some of the more trivial plots. Finally, the code under the hide button is not entirely necessary for comprehension but could be useful to copy.
This book builds off the summer project completed by Sean Craven in the summer of 2021. The project was inspired by the plots of Dr Robert Rode [Rho] using the PyRads package [KC18].
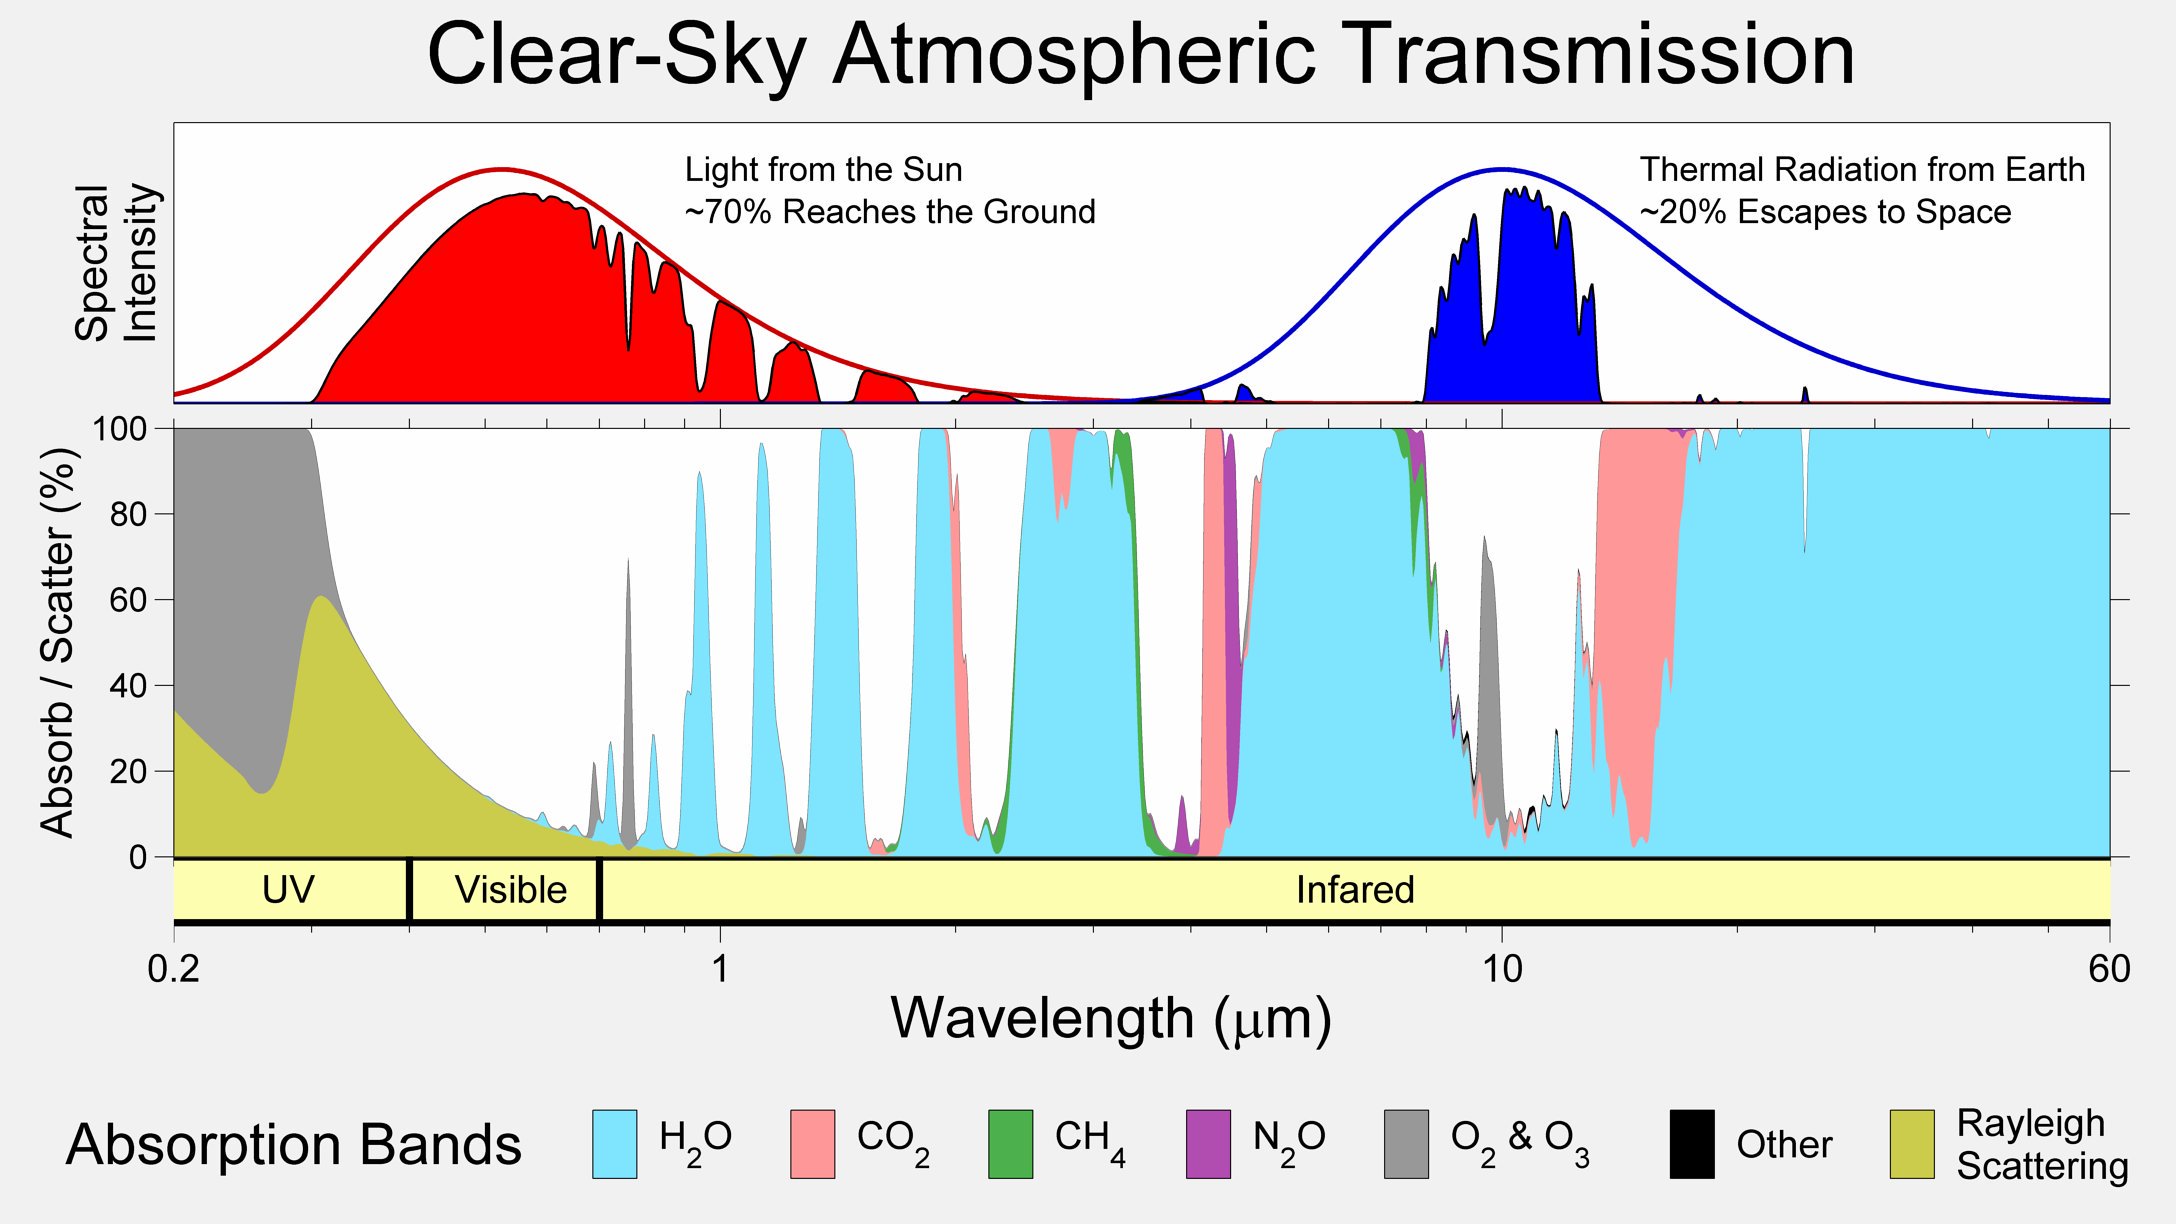
The above plot shows the transmission of solar radiation as a function of wavelength for multiple common greenhouse gases. This figure effectively communicates the wavelength dependence of molecular absorption and the ceiling in absorption provided by ozone and Rayleigh scattering. However, if one were to ask what gases contribute most to warming? Is methane more problematic than CO2? The figure does not communicate this. This should highlight how the data is formatted and processed affects the conclusions drawn and the information recovered.